Introduction
Types of Moving Averages
There are a number of different types of moving averages that vary in the way they are calculated, but how each average is interpreted remains the same. The calculations only differ in regards to the weighting that they place on the price data, shifting from equal weighting of each price point to more weight being placed on recent data. The two most popular types ofmoving averages are the Simple Moving Average(SMA) and the Exponential Moving Average(EMA). Thesemoving averages can be used to identify the direction of the trend or define potential support and resistance levels.
The Lag Factor
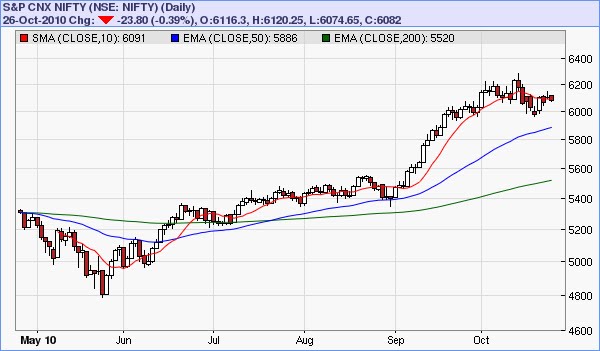
The longer the moving average, the more the lag. A 10-day moving average will hug prices quite closely and turn shortly after prices turn. Short moving averages are like speed boats - nimble and quick to change. In contrast, a 200-day moving average contains lots of past data that slows it down. Longer moving averages are like ocean tankers - lethargic and slow to change. It takes a larger and longer price movement for a 200-day moving average to change course. Below chart shows the S&P CNX Nifty with a 10-day SMA closely following prices and a 200-day EMA grinding higher. The 50-day EMA fits somewhere between the 10 and 200 day moving averages when it comes to the lag factor.
Lengths and Timeframes
The length of the moving average depends on the analytical objectives. Short moving averages (5-20 periods) are best suited for short-term trends and trading. Chartists interested in medium-term trends would opt for longer moving averages that might extend 20-60 periods. Long-term investors will prefer moving averages with 100 or more periods.
Some moving average lengths are more popular than others. The 200-day moving average is perhaps the most popular. Because of its length, this is clearly a long-term moving average. Next, the 50-day moving average is quite popular for the medium-term trend. Many chartists use the 50-day and 200-day moving averages together. Short-term, a 10-day moving average was quite popular in the past because it was easy to calculate. One simply added the numbers and moved the decimal point.
No comments:
Post a Comment